Property Record
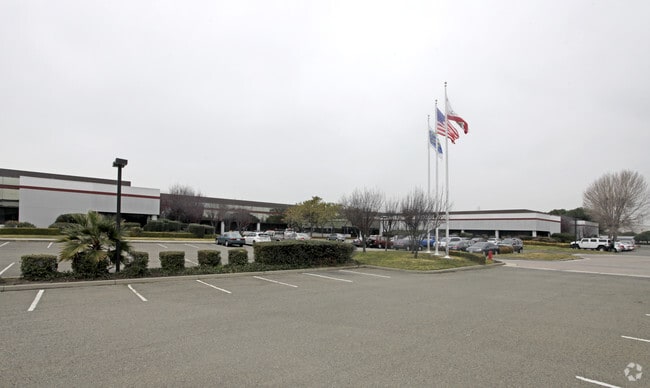
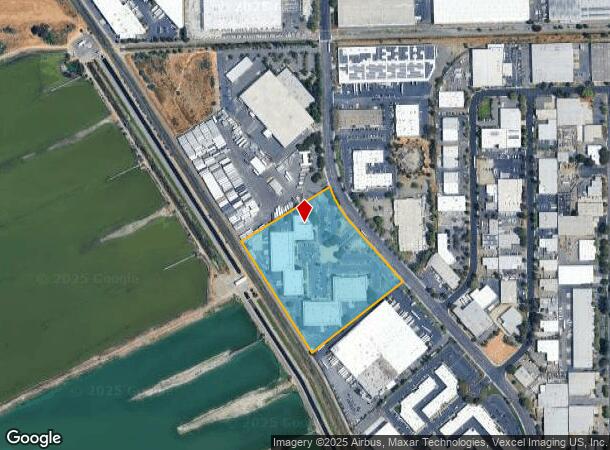
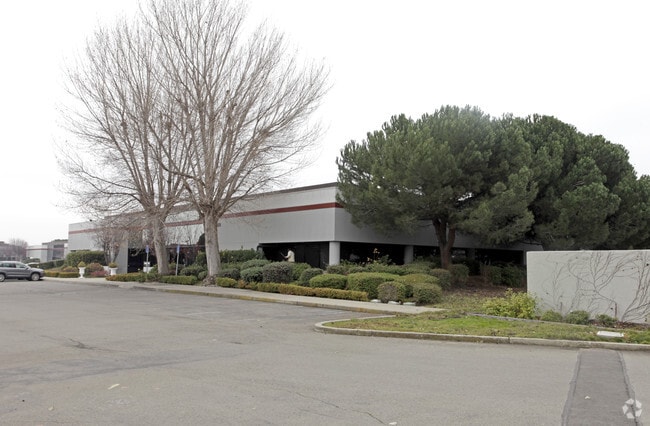
21325 Cabot Blvd, Hayward, CA 94545
Current Lease Availabilities
NEARBY LISTINGS FOR SALE OR LEASE
Property Detail
21325 Cabot Blvd
Oakland-Hayward-Berkeley, CA
Parcel Map #5207
439-0035-057-00
LOT: 00001 BLK: PM: 0172 PAGE: 0039
Lightindustrial
Alameda
X
California
06001C0269H
1
2024
11.80 AC
2025
Hayward/Castro Valley
437101
East Bay/Oakland
137,625 SF
DEMOGRAPHICS near 21325 Cabot Blvd
1 Mile
3 Mile
5 Mile
2024 Total Population
21
84,358
276,759
2029 Population
19
81,223
267,499
Pop Growth 2024-2029
(9.52%)
(3.72%)
(3.35%)
Average Age
40
40
40
2024 Total Households
7
25,739
87,528
HH Growth 2024-2029
(14.29%)
(3.96%)
(3.53%)
Median Household Inc
$175,000
$94,086
$90,594
Avg Household Size
3.10
3.10
3.00
2024 Avg HH Vehicles
2.00
2.00
2.00
Median Home Value
$750,000
$726,090
$724,958
Median Year Built
1974
1961
1967
Nearby Places
Map Layers
Map Styles
 Street
 Aerial
- Restaurants
- Banks
- Shops
- Fitness
- Groceries
PUBLIC TRANSPORTATION
COMMUTER RAIL
Hayward (Capitol Corridor - Capitol Corridor Joint Powers Authority)
DRIVE
WALK
Distance
Hayward (Capitol Corridor - Capitol Corridor Joint Powers Authority)
10 min
4.4 mi
Hayward Amtrak (Capitol Corridor - Amtrak)
DRIVE
WALK
Distance
Hayward Amtrak (Capitol Corridor - Amtrak)
10 min
4.4 mi
AIRPORT
Metro Oakland International
DRIVE
WALK
Distance
Metro Oakland International
21 min
12.7 mi
San Francisco International
DRIVE
WALK
Distance
San Francisco International
29 min
21.0 mi
Norman Y Mineta San Jose International
DRIVE
WALK
Distance
Norman Y Mineta San Jose International
37 min
28.7 mi
Freight Ports
Port of Redwood City
DRIVE
WALK
Distance
Port of Redwood City
30 min
21.5 mi
Nearby Properties
Address
Land Use
TOTAL SIZE
Lot Size
Zoning
Address
Land Use
TOTAL SIZE
Lot Size
Zoning
710,091 SF
50.34 AC
Address
Land Use
TOTAL SIZE
Lot Size
Zoning
367,398 SF
21.94 AC
Address
Land Use
TOTAL SIZE
Lot Size
Zoning
6.57 AC
Address
Land Use
TOTAL SIZE
Lot Size
Zoning
500,913 SF
22.59 AC
Address
Land Use
TOTAL SIZE
Lot Size
Zoning
240,556 SF
11.63 AC
Address
Land Use
TOTAL SIZE
Lot Size
Zoning
200,451 SF
11.22 AC
Address
Land Use
TOTAL SIZE
Lot Size
Zoning
236,976 SF
18.36 AC
Address
Land Use
TOTAL SIZE
Lot Size
Zoning
10.64 AC
Address
Land Use
TOTAL SIZE
Lot Size
Zoning
333,302 SF
13.20 AC
Address
Land Use
TOTAL SIZE
Lot Size
Zoning
Address
Land Use
TOTAL SIZE
Lot Size
Zoning
150,856 SF
5.99 AC
Address
Land Use
TOTAL SIZE
Lot Size
Zoning
300,507 SF
15.52 AC
Address
Land Use
TOTAL SIZE
Lot Size
Zoning
160,987 SF
7.20 AC
Address
Land Use
TOTAL SIZE
Lot Size
Zoning
297,592 SF
11.65 AC
Address
Land Use
TOTAL SIZE
Lot Size
Zoning
10.69 AC
Address
Land Use
TOTAL SIZE
Lot Size
Zoning
242,861 SF
17.57 AC
Address
Land Use
TOTAL SIZE
Lot Size
Zoning
147,489 SF
9.90 AC
Address
Land Use
TOTAL SIZE
Lot Size
Zoning
137,889 SF
18.44 AC
Address
Land Use
TOTAL SIZE
Lot Size
Zoning
116,750 SF
4.72 AC
Address
Land Use
TOTAL SIZE
Lot Size
Zoning
146,944 SF
4.21 AC
Address
Land Use
TOTAL SIZE
Lot Size
Zoning
168,372 SF
10.90 AC
Address
Land Use
TOTAL SIZE
Lot Size
Zoning
143,154 SF
6.15 AC
Address
Land Use
TOTAL SIZE
Lot Size
Zoning
140,850 SF
9.98 AC
Address
Land Use
TOTAL SIZE
Lot Size
Zoning
89,968 SF
5 AC
Address
Land Use
TOTAL SIZE
Lot Size
Zoning
329,346 SF
29.36 AC
Address
Land Use
TOTAL SIZE
Lot Size
Zoning
59,012 SF
5.51 AC
Address
Land Use
TOTAL SIZE
Lot Size
Zoning
Address
Land Use
TOTAL SIZE
Lot Size
Zoning
106,555 SF
29.34 AC
Address
Land Use
TOTAL SIZE
Lot Size
Zoning
232,864 SF
12.23 AC
Address
Land Use
TOTAL SIZE
Lot Size
Zoning
456,785 SF
19.42 AC
The World's #1 Commercial Real Estate Marketplace
Connect with us
© 2025 CoStar Group
The information above has been obtained from sources believed reliable. While we do not doubt its accuracy we have not verified it and make no guarantee, warranty or representation about it. It is your responsibility to independently confirm its accuracy and completeness. Any projections, opinions, assumptions, or estimates used are for example only and do not represent the current or future performance of the property. The value of this transaction to you depends on tax and other factors which should be evaluated by your tax, financial, and legal advisors. You and your advisors should conduct a careful, independent investigation of the property to determine to your satisfaction the suitability of the property for your needs.